Strategies
Navigation
Ten-Year BacktestHow to FollowGrowth
Community
𝕏Discord · X

Steady · 10-year backtestSteady Backtest

Backtest · not live
Trend $1,000 + Cycle $1,000 + Session $1,500 = combined $3,500 · all with fixed position sizing · same strategy engine as Growth
※ Backtest figure caliber: 10-year historical backtest · Bybit full cost (measured spread + $6 round-trip commission) · spreads measured across the full sample (08-05~08-10, 6 sampling days) · re-check confirmed zero drift · backtest projections, not a promise of returns · live figures (the top three cards and the delayed block) carry their own 15-minute delayed caliber label, kept strictly separate from backtest figures.
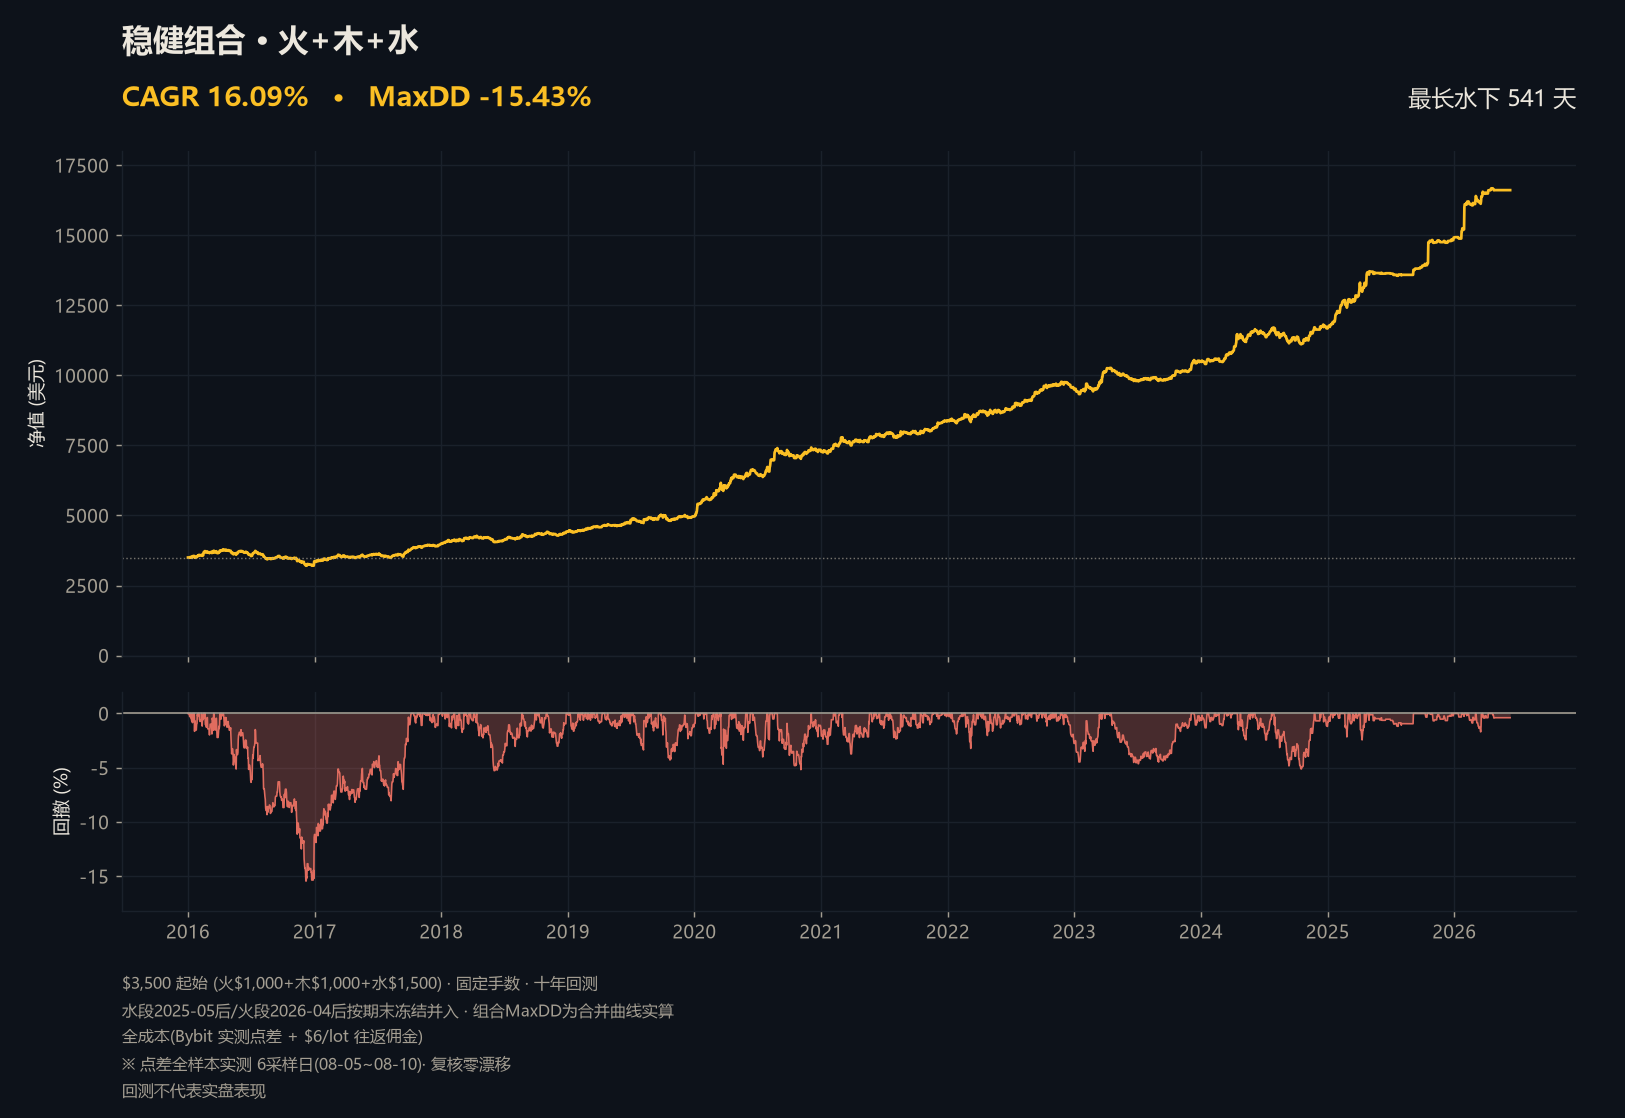
Portfolio · Steady portfolio (Trend+Cycle+Session)(2016-01 ~ 2026-06)
Total return · from $3,500
+374.70%
CAGR (compound annual)
16.09%
Max drawdown
-15.43%
Longest underwater
541 days
10-year ending value
$16,615
Portfolio · Steady portfolio (Trend+Cycle+Session)
Portfolio longest underwater: 637 days at the admission-criteria caliber (ruled 2026-08-06); 541 days computed at Bybit full-cost caliber —— the difference comes from the cost model. Single-strategy underwater (Trend 1194 days) is a disclosure item, not an admission gate. In the combined curve, the Session data segment ends 2025-05 and the Trend segment ends 2026-04; afterwards each is frozen at its end-of-period equity and merged, with no extrapolation.
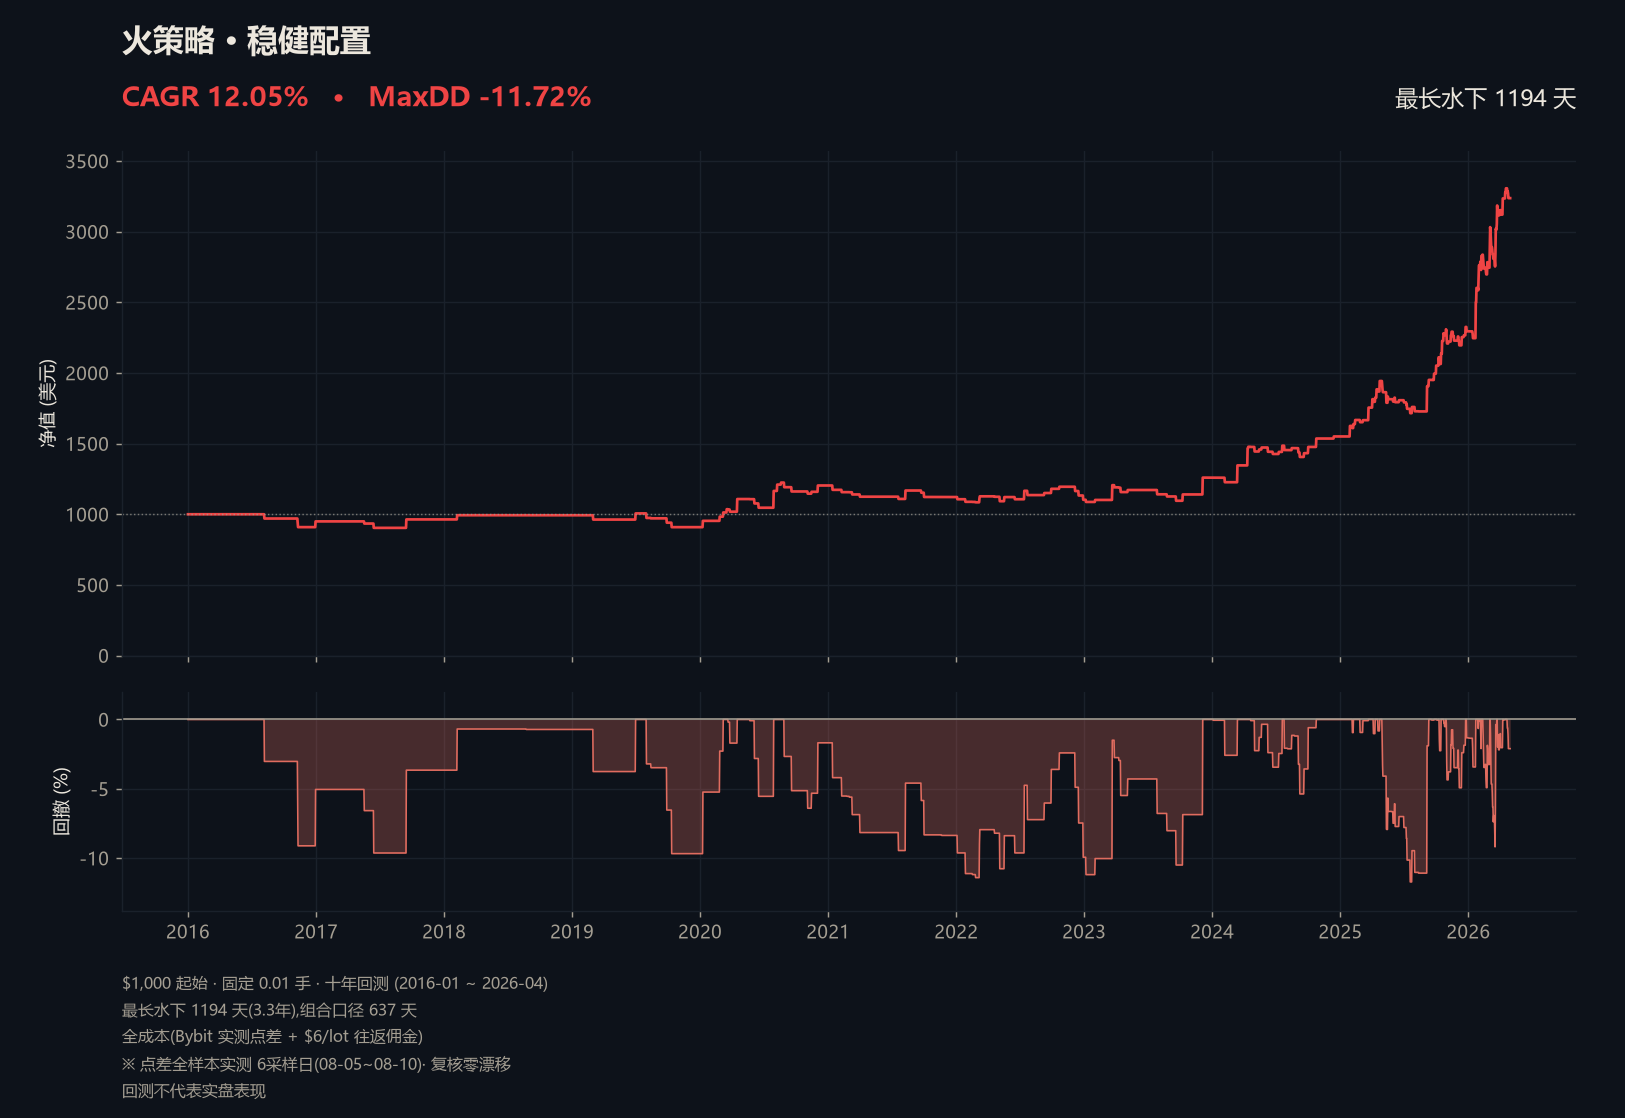
Trend · ten-year backtest(2016-01 ~ 2026-04)
Tiered sizing · trend reversal · fixed position sizing
Total return · from $1,000
+223.71%
CAGR (compound annual)
12.05%
Max drawdown
-11.72%
Longest underwater
1194 days
Payoff ratio
1.70
Worst single trade
-7.4%
10-year ending value
$3,237
Trend · ten-year backtest
YearTradesYearly P/L $Year-end equity $Deepest intra-year drawdown
20164-50.47950-9.11%
20173+13.92963-4.83%
20182+29.36993-0.03%
20196-84.14909-9.68%
202018+294.871,204-6.40%
202111-81.791,122-7.90%
202218-19.281,102-7.72%
202312+156.801,259-9.14%
202423+291.281,551-5.37%
202567+743.932,295-11.72%
202692+942.623,237-9.19%
The yearly breakdown comes from the same backtest chain; losing years are shown in full, with no touch-ups.
Trend/Cycle/Session live accounts have executed off the master-account signals since 2026-08-18 (not independent engines);Figures in this section are standalone strategy backtests; copy execution adds latency and spread slippage.
Downside disclosure — longest underwater 1194 days (about 3.3 years)

At the fixed-position-sizing caliber, the 10-year Trend backtest once went 1194 days (about 3.3 years) without a new high, in a long sideways stretch (2020-08 to 2023-12). The admission criterion uses the portfolio-caliber 637-day underwater figure (three strategies held together, ruled 2026-08-06); the single-strategy 1194 days remains a disclosure item. Max drawdown -11.72%, worst single trade about -7.4%. Participate only with idle capital that can endure long stretches without new highs. Past performance is not indicative of future results.
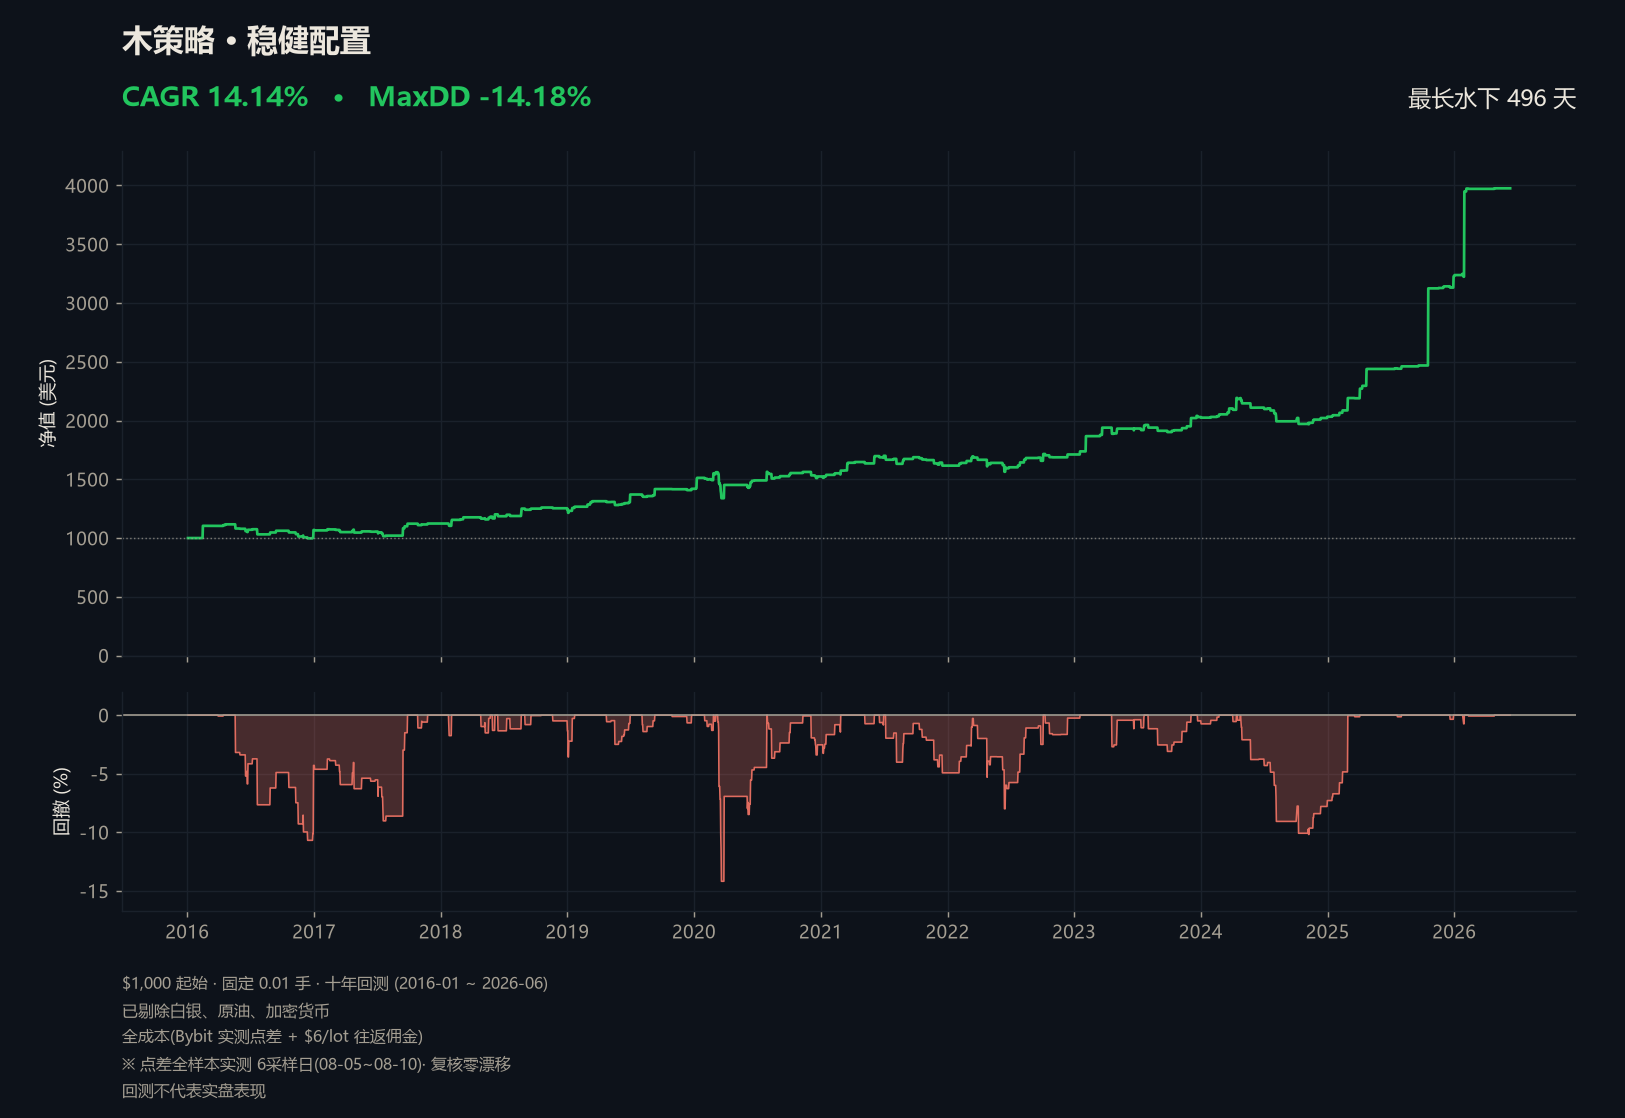
Cycle · 10-year backtest(2016-01 ~ 2026-06)
Fully automated two-way quant · silver, crude oil and crypto excluded · fixed position sizing
Total return · from $1,000
+297.60%
CAGR (compound annual)
14.14%
Max drawdown
-14.18%
Longest underwater
496 days
Payoff ratio
2.61
Worst single trade
-7.6%
10-year ending value
$3,976
Cycle · 10-year backtest
YearTradesYearly P/L $Year-end equity $Deepest intra-year drawdown
201623+68.861,069-10.69%
201726+54.651,124-5.49%
201824+119.051,253-1.75%
201927+176.421,419-2.49%
202048+105.061,524-14.18%
202135+92.111,616-4.92%
202232+94.981,711-7.74%
202324+318.572,030-3.09%
202438+2.712,032-10.18%
202524+1201.293,225-0.35%
202611+742.333,976-0.74%
The yearly breakdown comes from the same backtest chain; losing years are shown in full, with no touch-ups.
Symbol exclusion disclosure — Steady is a reduced configuration

Steady’s Cycle strategy excludes silver, crude oil and crypto: under this platform’s contract specs, a single fixed-size trade on silver or oil swings roughly 5~10 times the regular caliber — beyond this portfolio’s risk budget — and crypto instruments are not offered on the platform. Gold and six FX pairs are retained. 10-year backtest max drawdown -14.18%, longest underwater 496 days, worst single trade about -7.6%. Drawdowns and losses are just as real; past performance is not indicative of future results.
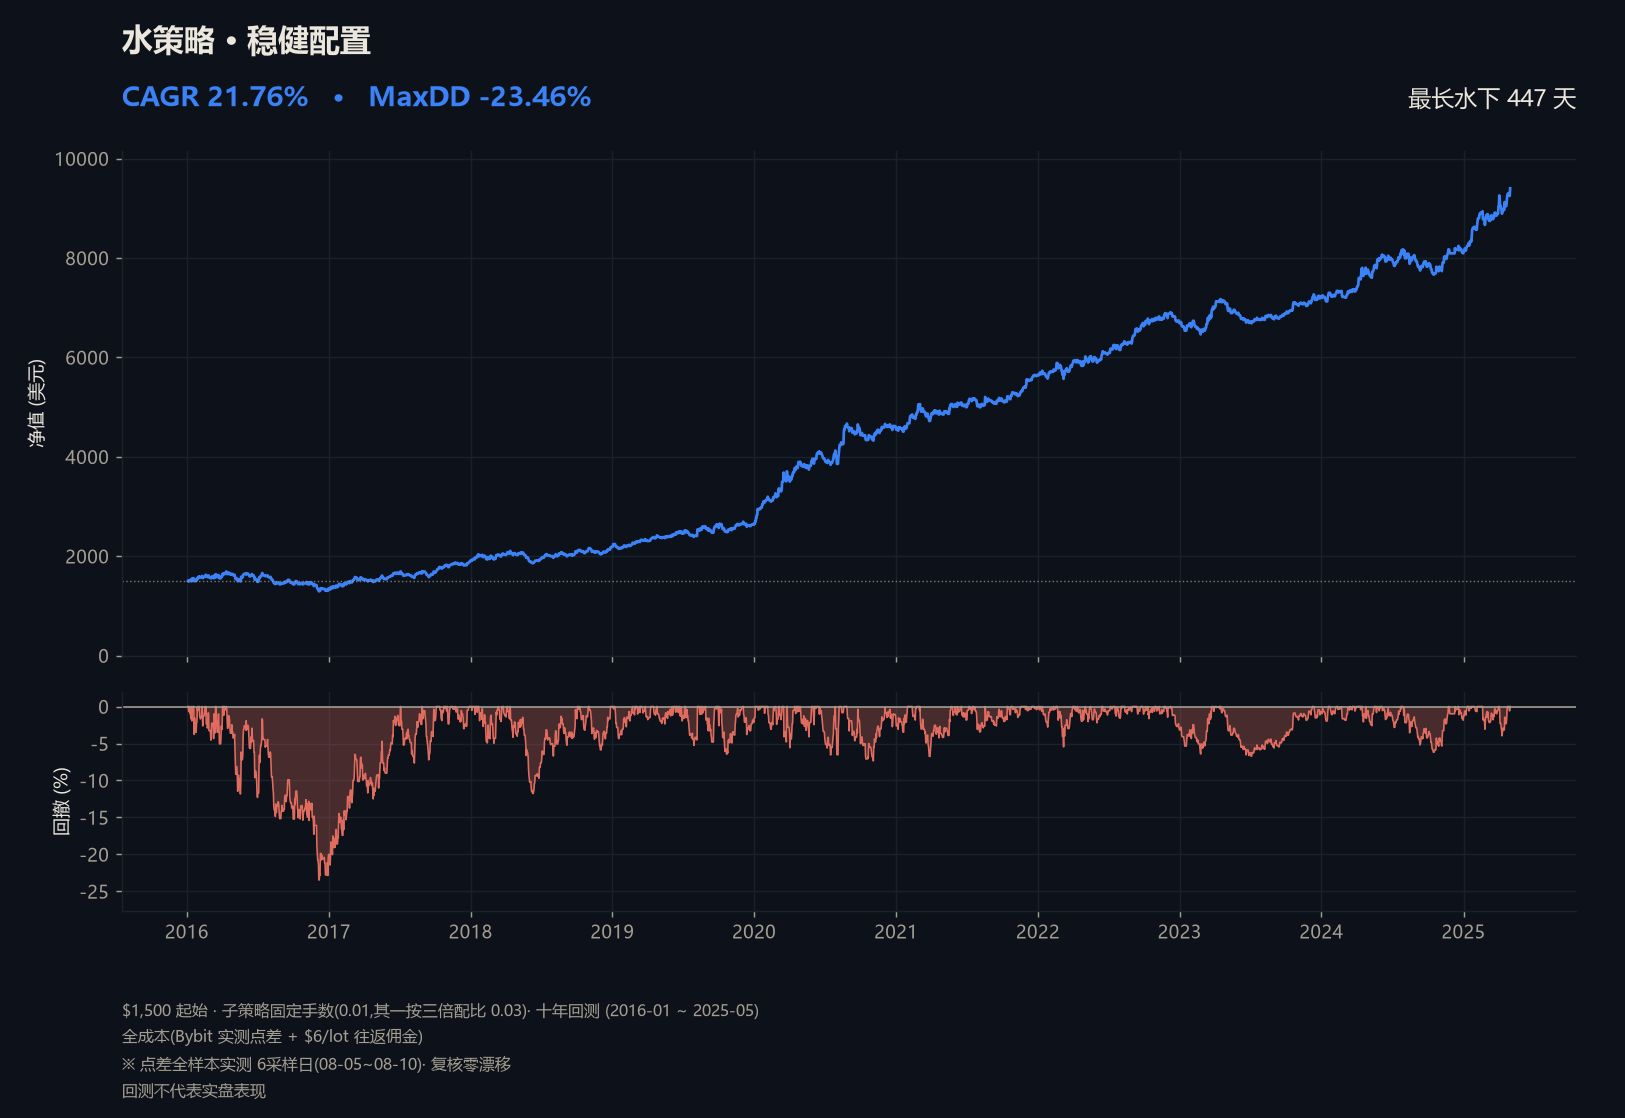
Session · 10-year backtest(2016-01 ~ 2025-05)
Multi-sub-strategy portfolio · trend capture · fixed position sizing per sub-strategy (one runs at a preset triple weighting)
Total return · from $1,500
+526.77%
CAGR (compound annual)
21.76%
Max drawdown
-23.46%
Longest underwater
447 days
Payoff ratio
1.23
Worst single trade
-9.7%
10-year ending value
$9,401
Session · 10-year backtest
YearTradesYearly P/L $Year-end equity $Deepest intra-year drawdown
2016505-148.351,352-23.46%
2017565+552.411,904-7.64%
2018614+285.732,184-11.78%
2019535+461.352,635-6.44%
2020537+1893.584,594-7.36%
2021503+1107.115,630-6.75%
2022556+1036.096,688-5.45%
2023543+529.167,217-6.73%
2024537+921.088,092-6.19%
2025187+1263.329,401-3.96%
The yearly breakdown comes from the same backtest chain; losing years are shown in full, with no touch-ups.
Drawdown disclosure — deepest -23.46%, a deep early hole

At the $1,500 fixed-position-sizing caliber, Session’s 10-year backtest max drawdown was -23.46% (in the opening year, 2016), longest underwater 447 days, worst single trade about -9.7% (close to the 10% single-trade disclosure line). One sub-strategy runs at a preset triple allocation, so drawdowns concentrate in its losing streaks. This is not a smooth curve — participate only with idle capital that can absorb a 20%-plus drawdown. Past performance is not indicative of future results.
Method · Caliber Notes
Cost and sample caliber

All figures are a 10-year backtest at Bybit platform caliber: cost = median of the measured spread distribution + $6 round-trip commission (verified with live probe orders). Spreads cover the full sample (08-05~08-10, 6 sampling days / 126×10k ticks); a re-check confirmed zero drift in the median spread of each of the seven instruments (consistent with the initial read), so the figures on this page stand unchanged. Position sizing follows a unified baseline caliber and does not scale with equity. Everything on this page is backtest projection, this portfolio has no live trades yet, and past performance is not indicative of future returns.

No live trades yet · pending launch
Steady has not produced any live trades yet; once live, real-account data will be shown in its own section, separate from this backtest page — never passed off as one another.
×

Start Following

Before following, please read How to Follow →
Trend · FireautoStart Following ↗
Cycle · WoodautoStart Following ↗
Session · WaterautotradeStart Following ↗
GridVerification periodStart Following ↗
WeChatRayraysoil01
Telegram@rayraysoil
中文