Strategies
Navigation
Ten-Year BacktestHow to FollowGrowth
Community
𝕏Discord · X

🔥 TrendSteady

Risk level medium · Max drawdown -11.72%
Tiered sizing · trend reversal · fixed position sizing · Steady (fixed position sizing) · no live trades yet · Executes signals from the master account (not an independent engine)
Risk tiering basis: ranked by max drawdown in the ten-year backtest — The three Steady strategies range from -11.72% ~ -23.46% (medium / medium-high); the Growth equivalents span -36% ~ -71% (high / extreme). Tier calibers differ — do not compare directly.
Start Following ↗Max drawdown -11.72% · Longest underwater 1194 days
※ Backtest figure caliber: 10-year historical backtest · Bybit full cost (measured spread + $6 round-trip commission) · spreads measured across the full sample (08-05~08-10, 6 sampling days) · re-check confirmed zero drift · backtest projections, not a promise of returns · live figures (the top three cards and the delayed block) carry their own 15-minute delayed caliber label, kept strictly separate from backtest figures.
Performance · ten-year backtest results (backtest projections · not a promise · not live)
Ten-year backtest total return
$1,000 → $3,237
+223.71% · Bybit full-cost caliber · 2016-01 ~ 2026-04 · backtest projection, not a promise
CAGR 12.05% · compound annual growth, not a fixed yearly return · This figure is from the strategy’s standalone backtest; copied execution carries latency and spread deviations
Historical max drawdown
-11.72%
Shown alongside CAGR · upside and downside on the same page
Longest underwater period
1194 days
Longest wait before a new high · portfolio caliber 637 days (admission criterion); single-strategy figures are disclosure items
CAGR in the chart is annualized · compound annual growth, not a fixed yearly return · total return shown in the metric cards above
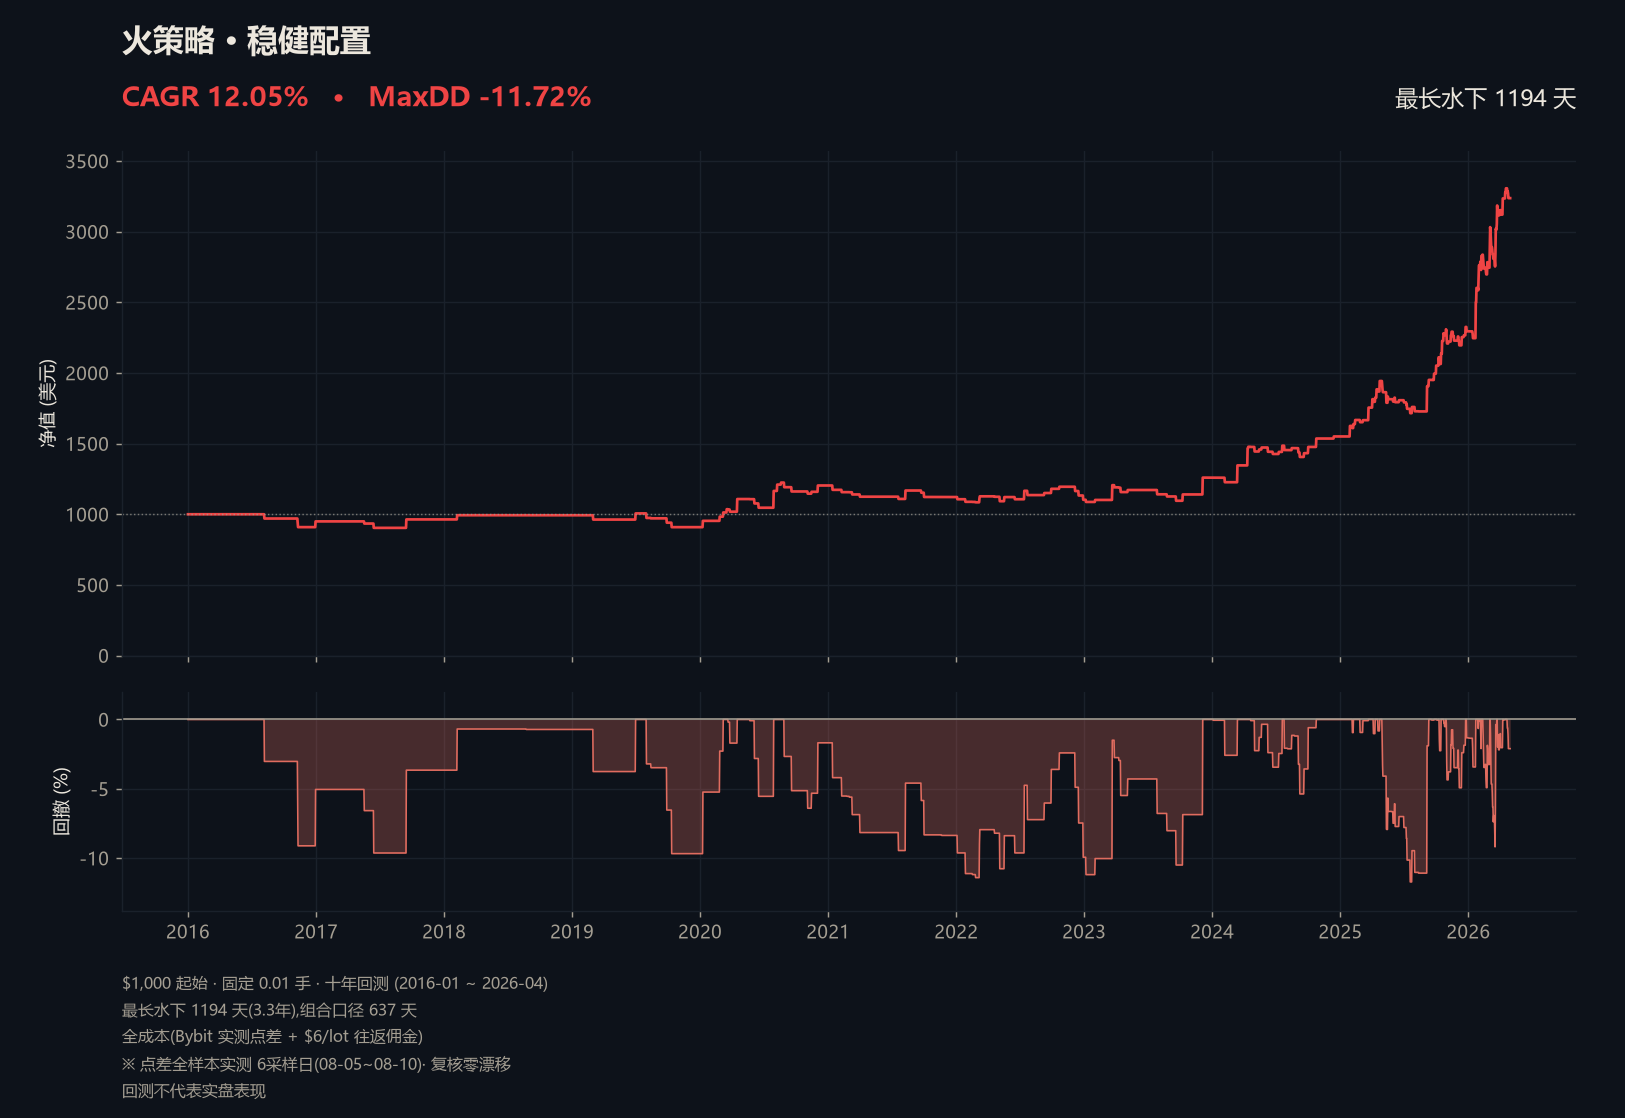
Trend ten-year backtest: equity and drawdown
Live · delayed positions and equity (15-minute delay)
Current equity · 15-minute delay
$1,080.69
Reconciled trade-by-trade against broker statements (position_id matched) · full-cost caliber · 15-minute delay
Delayed positions · snapshot from 15 minutes ago
ShortXAUUSDOpened unknown (delayed)unknown
Floating P/L shown as a share of account equity · not a promise of returns
History · All trade records · Profits and losses shown in full
All trades · unfiltered · full-cost caliber (commission and funding fees included) · read directly from the broker
Close dateSymbolDirectionHolding timeNet P/L $Net PnL %
2026-09-09XAUUSDShort0h01m+0.01+0.00%
2026-09-09XAUUSDShort6h39m-0.07-0.01%
2026-09-04XAUUSDShort0h01m-0.15-0.01%
2026-09-04XAUUSDShort0h57m+11.89+1.13%
2026-09-01XAUUSDShort0h01m+0.91+0.09%
2026-09-01XAUUSDShort1h20m-1.94-0.18%
2026-08-31XAUUSDShort0h01m+0.00+0.00%
2026-08-31XAUUSDShort56h18m+14.13+1.37%
2026-08-28XAUUSDLong0h01m+9.70+0.95%
2026-08-28XAUUSDLong0h05m-35.57-3.35%
2026-08-26XAUUSDLong0h01m+5.32+0.50%
2026-08-26XAUUSDLong5h45m-31.56-2.90%
2026-08-24XAUUSDLong0h01m-2.08-0.19%
2026-08-24XAUUSDLong56h05m-19.15-1.73%
2026-08-21XAUUSDLong0h00m-0.37-0.03%
2026-08-21XAUUSDLong5h09m+35.63+3.32%
2026-08-21XAUUSDLong0h01m-0.35-0.03%
2026-08-21XAUUSDLong15h18m+49.46+4.83%
2026-08-19XAUUSDLong0h00m+1.19+0.12%
2026-08-18XAUUSDLong10h37m-31.24-2.96%
2026-08-17XAUUSDLong72h07m-1.60-0.15%
2026-08-12XAUUSDLong0h00m-35.38-3.24%
2026-08-11XAUUSDLong10h49m+27.50+2.59%
2026-08-07XAUUSDLong8h14m+58.17+5.79%
Backtest · 10-year history
Total return · from $1,000
+223.71%
CAGR (compound annual)
12.05%
Max drawdown
-11.72%
Longest underwater
1194 days
Payoff ratio
1.70
Worst single trade
-7.4%
10-year ending value
$3,237
View the full 10-year Steady backtest: combined curve / year-by-year breakdown / caliber notes →
Risk Disclosure
Downside disclosure — longest underwater 1194 days (about 3.3 years)

At the fixed-position-sizing caliber, the 10-year Trend backtest once went 1194 days (about 3.3 years) without a new high, in a long sideways stretch (2020-08 to 2023-12). The admission criterion uses the portfolio-caliber 637-day underwater figure (three strategies held together, ruled 2026-08-06); the single-strategy 1194 days remains a disclosure item. Max drawdown -11.72%, worst single trade about -7.4%. Participate only with idle capital that can endure long stretches without new highs. Past performance is not indicative of future results.

Access · Start Following
Open for following · live track record accruing
Trend is now open for following on Bybit; the live record accumulates here from the first trade, reconcilable trade by trade.Read the risk disclosure above before following. Grid is not part of Steady (a human-directed, machine-executed strategy in its verification period, with structural liquidation risk).
Not registered with Bybit yet?Open an account (invite code YOXYGMV)↗
Following is completed on the Bybit platform; clicking takes you to the corresponding lead-trader page
×

Start Following

Before following, please read How to Follow →
Trend · FireautoStart Following ↗
Cycle · WoodautoStart Following ↗
Session · WaterautotradeStart Following ↗
GridVerification periodStart Following ↗
WeChatRayraysoil01
Telegram@rayraysoil
中文